Page 10 - Cuero, TX Downtown Plan
P. 10

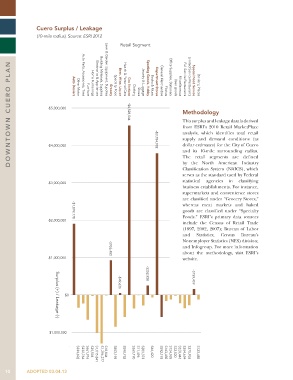
Cuero Surplus / Leakage

                (10-mile radius), Source: ESRI 2012
                                                   Retail Segment


     DOWNTOWN CUERO PLAN


                                             Lawn & Garden Equipment, Supplies
                                    Auto Parts, Accessories, Tires
                                           Building Materials, Supplies
                     -$5,000,000  Auto Dealers  Other Motor  Furniture  Home Furnishings  Electronics & Appliances  Grocery  Specialty Food  Beer, Wine, Liquor  Health & Personal Care  Gas Stations  Clothing  Shoes  Jewelry & Luggage  Sporting Goods, Hobby  Books & Music  Department Stores  General Merchandise  Florists  Office Supplies, Stationary  Used goods  Miscellaneous  Full Service Restaurants  Limited Service Restaurants  Special Food Service  Drinking Places
                                                                             Methodology
                                                                             This surplus and leakage data is derived
                                                       -$4,528,544
                                                                             from  ESRI’s  2010  Retail  MarketPlace
                                                                             analysis,  which  identifies  total  retail
                                                                             supply  and  demand  conditions  (as
                     -$4,000,000                                             dollar estimates) for the City of Cuero
                                                                  -$3,784,902
                                                                             and  its  10-mile  surrounding  radius.
                                                                             The  retail  segments  are  defined
                                                                             by  the  North  American  Industry
                                                                             Classification System (NAICS), which
                                                                             serves as the standard used by Federal
                                                                             statistical  agencies  in  classifying
                     -$3,000,000
                                                                             business establishments. For instance,
                                                                             supermarkets and convenience stores
                                                                             are classified under “Grocery Stores,”
                                                                             whereas  meat  markets  and  baked
                                                                             goods  are  classified  under  “Specialty
                                                                             Foods.”  ESRI’s  primary  data  sources
                     -$2,000,000
                               -$1,899,178
                                                                             include the Census of Retail Trade
                                                                             (1997, 2002, 2007); Bureau of Labor
                                                                             and   Statistics;  Census  Bureau’s
                                                                             Nonemployer Statistics (NES) division;
                                                                             and Infogroup. For more information
                                                                             about the methodology, visit ESRI’s
                                               -$926,480
                     -$1,000,000                              -$252,928      website.


                            $0                     -$49,636                       -$159,439


                        Surplus (+) / Leakage (-)
                      $1,000,000


   10       ADOPTED 03.04.13     $344,692  $232,764  $661,976  $25,504  $1,015,841  $1,296,277  $18,844  $853,198  $590,782  $363,190  $11,496  $283,373  $66,420  $592,193  $163,435  $124,035  $22,520  $220,446  $354,634  $275,926  $123,485
   5   6   7   8   9   10   11   12   13   14   15