
Page 10 - Murfreesboro, TN Comprehensive Plan: Chapter 7, Economic Development
P. 10
7.10 Chapter 7
DRAFT 12.02.15
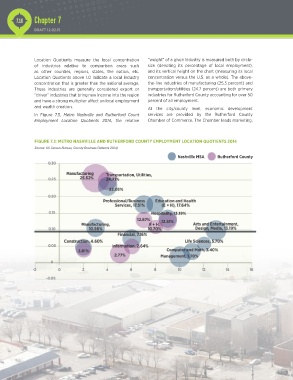
Location Quotients measure the local concentration “weight” of a given industry is measured both by circle-
of industries relative to comparison areas such size (denoting its percentage of local employment),
as other counties, regions, states, the nation, etc. and its vertical height on the chart (measuring its local
Location Quotients above 1.0 indicate a local industry concentration versus the U.S. as a whole). The above-
concentration that is greater than the national average. the-line industries of manufacturing (25.5 percent) and
These industries are generally considered export or transportation/utilities (24.7 percent) are both primary
“driver” industries that bring new income into the region industries for Rutherford County accounting for over 50
and have a strong multiplier affect on local employment percent of all employment.
and wealth creation. At the city/county level, economic development
In Figure 7.3, Metro Nashville and Rutherford Count services are provided by the Rutherford County
Employment Location Quotients 2014, the relative Chamber of Commerce. The Chamber leads marketing,
FIGURE 7.3: METRO NASHVILLE AND RUTHERFORD COUNTY EMPLOYMENT LOCATION QUOTIENTS 2014
Source: US Census Bureau, County Business Patterns 2014)
Nashville MSA Rutherford County
0.30
Manufacturing Transportation, Utilities,
0.25 25.52% 24.71%
23.03%
0.20
Professional/Business Education and Health
Services, 17.51% (E + H), 17.64%
0.15 Hospitality, 13.19%
12.87%
Manufacturing, E + H, 12.51% Arts and Entertainment,
0.10 10.56% 10.70% Design, Media, 13.19%
Financial, 7.16%
Construction, 4.60% Life Sciences, 5.70%
0.05 Information, 2.64%
3.81% Computer and Math, 3.40%
2.77% Management, 1.70%
0
-2 0 2 4 6 8 10 12 14 16
-0.05